Jump to content
Green Blog
Simon
Simon

A Picture is Worth... The Global Distribution of Water

This graphic clearly shows the scarcity of water, especially drinkable freshwater, and what increasing global temperatures can result in.

The graphic comes from UNEP, the United Nations Environment Programme.
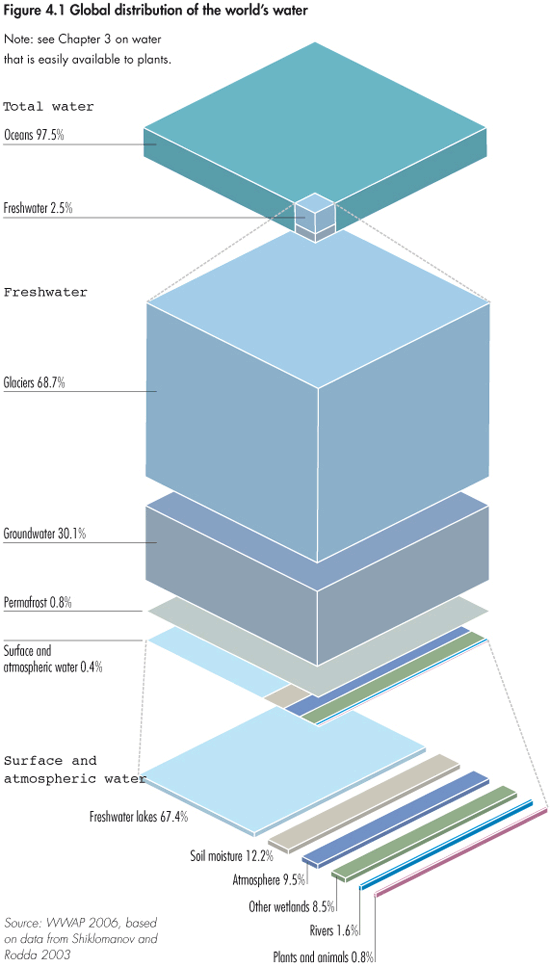
The Global Distribution of Water

Older entries:

- A Picture is Worth... Gasoline Consumption Per Day

- A Picture is Worth... Albatross Carcass

- A Picture is Worth... Car, bus or bicycle?

User Feedback

Recommended Comments


Join the conversation

You can post now and register later. If you have an account, sign in now to post with your account.

Guest
Add a comment...

×   Pasted as rich text.   Restore formatting

  Only 75 emoji are allowed.

×   Your link has been automatically embedded.   Display as a link instead

×   Your previous content has been restored.   Clear editor

×   You cannot paste images directly. Upload or insert images from URL.

Loading...

×
×
  • Create New...

Important Information

We have placed cookies on your device to help make this website better. You can adjust your cookie settings, otherwise we'll assume you're okay to continue. We use cookies and other tracking technologies to improve your browsing experience on our site, show personalized content, analyze site traffic, and understand where our audience is coming from. To find out more, please read our Privacy Policy. By choosing I Accept, you consent to our use of cookies and other tracking technologies.