
This is part three of a series of articles that take a closer look on the relationship between increasing human population levels and the food production system that sustains human livelihoods.
Part two has shown that the claim that population growth happens at an exponential rate is a common theme among populationists and Malthus-inspired thinkers. It has also showed how little faith Malthus and other populationists has on technology and scientific advancements as well as government regulations to increase our food production. Modern population theory has also seen a shift in focus. While Malthus and older scholars talked mainly about population levels and its relation to our agricultural food production system, modern populationists often has an environmental aspect to their arguments. Kaplan and especially Ehrlich can be used as examples of this as they often emphasizes the environmental damage which is caused by technologies such as the Green Revolution and an increasingly growing agriculture sector. Part three and four will examine many of the claims from populationists to see if the current situation is a gloomy as they say.
This chapter looks on how population levels have progressed historically till today and what kind of future population growth we might expect. This will help us evaluate the severity of the population problem.
In 1830, the global population had reached one billion. This is about 50 years after Malthus published his first population essay. Roughly 100 years later the global population had increased with another billion. By 1960, or about 30 years later, the human population had grown to three billion. 15 years later in 1975 the fourth billion was added. Global population numbers reached five billion people only 12 years later. And at the end of October 2011, the UN announced that we had reached seven billion people. One can see how global population numbers have progressed since the 1950s and are projected to develop till 2050 in the figure below.
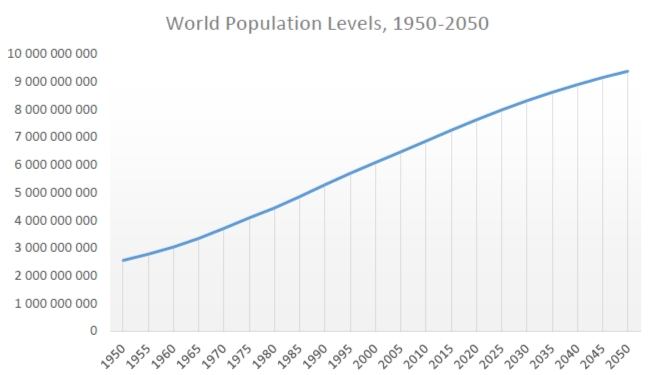 This graph shows the estimated and projected total midyear population levels for the world between 1950 and 2050. Source: U.S. Census Bureau, International Data Base, June 2012.
From a first quick look it might seem that global population levels are increasing. But a closer look reveals how global population growth is now starting to slightly decrease in speed. Malthus warned in his population theory that human population would increase in an exponential ratio. Ehrlich also warned about the dangers of an exponentially growing population. But as we can see from the graph above, no exponential population growth has taken place. Instead we can see a more linear development.
Another figure, which displays estimated and projected world population growth in percentage, shows a completely different picture than the previous graph. Here we can see a downward trend in global population growth. In fact, we can see how the world's population growth actually peaked and started to slow down around 1963 - five years before Paul and Anne Ehrlich published their population theory. Since around 1990 we can see a constant decrease in world population growth taking place. If this downward trend continues the population growth rate will have slowed down considerably by 2050. Again, no exponential or geometrical growth is taking place. Joel Cohen, a leading expert in population sciences, even goes as far as saying that human population "probably never has and probably never will" grow exponentially.
 The world's estimated and projected population growth rate between 1950 and 2050 in percent. Source: U.S. Census Bureau, International Data Base, June 2012.
UN population data offer four different scenarios for the future depending on different projections, the next figure shows these in more detail. One scenario, labeled constant fertility is the closest thing we get to an exponential population growth similar to what Malthus and other populationists have warned about. But this development is deemed unlikely and the UN predicts that the medium scenario is the most probable outcome. There's also a high and a low scenario connected to the medium projection, where population levels either increases more or less than anticipated.
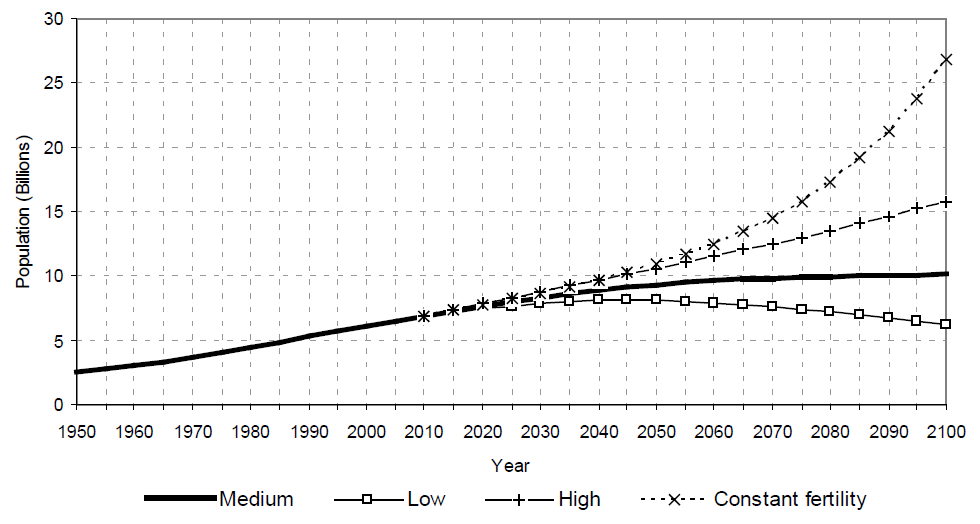 Future global population scenarios according to different projections and variants. Source: Population Division of the Department of Economic and Social Affairs of the United Nations Secretariat (2011). World Population Prospects: The 2010 Revision.
According to the medium scenario, global population is projected to increase with 2.3 billion to reach a total world population of 9.3 billion people by 2050. The majority of this population growth will take place in developing countries. 50 years later the global human population is projected to have reached 10.1 billion people. The majority of people, around 87 percent, will by 2100 live in the less developed regions in the world, while 27 percent of these will live in the least developed regions. Again, it's worth noting that these long-range population projections are extremely difficult to calculate correctly and in a reliable way. But if we are to trust the UN data, human population growth is expected to stabilize by 2100 at around 10 billion people.
Another variable to look at is the total fertility rate, namely the number of living children each women will have during her lifetime. Globally, replacement levels average around 2.3. In rich countries, where child mortality levels are low, the replacement level is about 2.1. In poorer countries which lack proper medical facilities and systems the number is obviously higher. Population levels will increase if the total fertility rate is higher than the replacement levels and vice versa. In many often rich and developed countries today, the total fertility rate is actually below the replacement levels. But this does not mean that the country's population levels won't see any further growth. The population will continue to grow for decades even though the total fertility rate has fallen well below the replacement levels. In other words, a reduction in birth rates is a demographic momentum which won't have any short-term effects on population levels. Many European countries today have fertility rates that are well below replacement levels. This has caused some demographers to project that by 2060 the total population in Japan could fall by nearly 50 percent and by around 25 percent in Europe.
This is why we recently could hear a lot of warnings about depopulation in the media, some even going as far as claiming that parts of Europe could become "almost deserted" in the years to come. Such cries rightfully seems alarmist but governments and institutions in developed countries are taking these warnings seriously. Just consider EU who recently issued a union-wide Blue Card, similar to the more well-known Green Card used by the US, in an effort to attract skilled workers from countries outside the union. UN data shows that populations aged 60 or older is the group that is growing the fastest globally today. In the developing world this population ageing will drastically increase in the coming decades. It is projected that population aged 60 or over will increase at annual rates of more than 3 percent. Another indicative of global population ageing are the increases in median age around the world. In 2011, 22 countries had a median age higher than 40 years. Japan had the oldest median age of 45 years. Germany was a close second with a median age of 44.7 years. According to the UN, "the implications of population ageing cannot be dismissed."
Part four takes a closer look on rising food costs and explains what actually caused the food price crisis in 2007-2008 (Hint: It wasn't actually because of a lack of food).
Recommended Comments
There are no comments to display.
Join the conversation
You can post now and register later. If you have an account, sign in now to post with your account.